Alternative to Practical tests whether you can reason from observations and results. A polished definition of osmosis will not fix an incorrect percentage-change calculation, and a beautiful leaf sketch is not useful if it changes the proportions of the specimen. Treat practical revision as a set of observable skills that you can practise and check. The examples here use invented data for learning.
Know the paper and the skills you are practising
The Cambridge Biology 0610 syllabus for 2026–2028 lists Paper 6 as a one-hour, 40-mark examination with 20% weighting. Its assessment guidance covers experimental skills and presentation of results. For drawings, it specifies clear pencil lines, use of the available space and no shading or colour. Refer to the current document for the full requirements.
Draw what is visible, with useful proportions
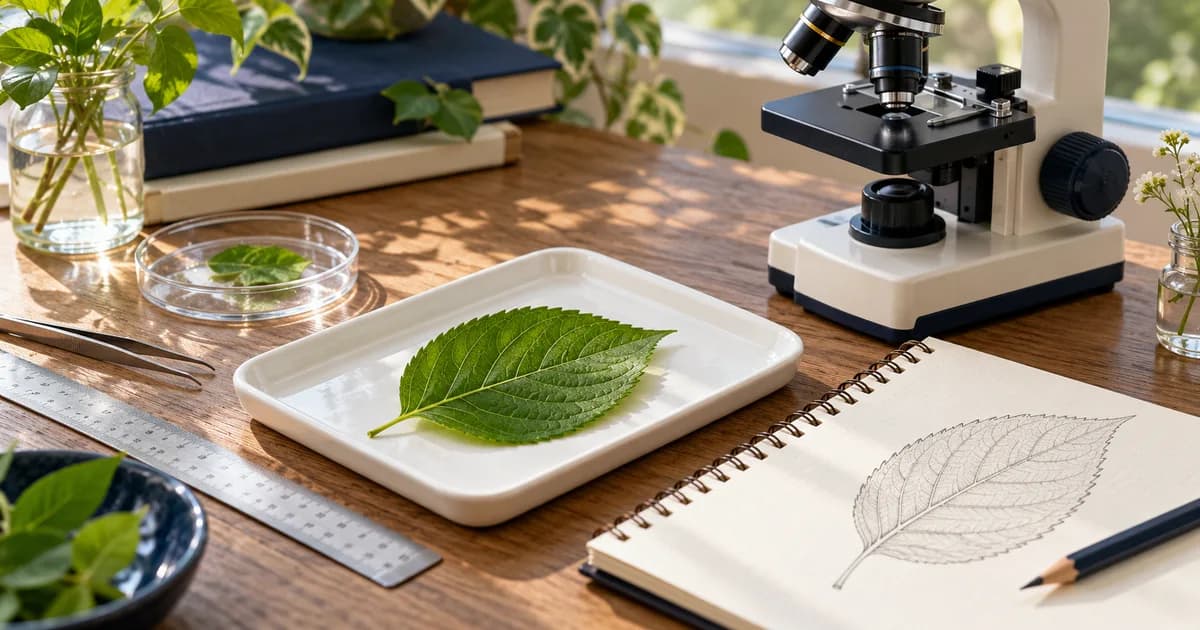
Start by comparing the specimen's overall height and width. Lightly plan where the outline will fit, then draw a single clear outline and add the visible internal features requested. A leaf that is twice as long as it is wide should not become almost circular in your drawing. Do not add remembered structures that the supplied image does not show.
When labels are requested, point each line to the exact feature you mean. Leave enough space around the drawing to avoid a cluster of crossing lines. As a practice check, ask someone to identify the labelled feature using only your line; if they cannot tell where it ends, improve the placement before adding more detail.
Worked magnification example
A printed image of a structure is 48 mm long. Its actual length is 0.60 mm. Magnification = image length ÷ actual length = 48 ÷ 0.60 = ×80. Both measurements were already in millimetres. If the actual length were instead given as 600 μm, first convert it to 0.600 mm and then do the same division.
Worked percentage-change example
In a practice osmosis data set, a potato cylinder starts at 2.40 g and finishes at 2.10 g. Its change in mass is 2.10 − 2.40 = −0.30 g. Percentage change = (−0.30 ÷ 2.40) × 100 = −12.5%. You can describe this as a 12.5% decrease. The original mass belongs in the denominator because the question compares the change with the starting value.
Keep the sign while calculating. A mass decrease and a mass increase should not appear identical in a results table. If you are asked to explain the change, connect it to the biological process and the evidence supplied; do not invent the solution concentration or tissue condition.
Make graphs readable and conclusions proportionate
Before plotting, check which quantity you control and which quantity you measure. Choose a consistent scale that makes the results easy to read, label quantities and units, and plot carefully. Follow the instructions about the line or curve. A graph with uneven numerical steps on an otherwise uniform axis can make an ordinary trend look dramatic.
| Check | Question to ask yourself | Example correction |
|---|---|---|
| Axes | Are both quantities and units clear? | Use time / min rather than only time |
| Scale | Does each equal interval represent the same change? | Keep the numerical step consistent |
| Data | Did I plot the measured values correctly? | Check a decimal point before moving a point |
| Conclusion | Does my statement stay within the evidence? | Describe the tested range rather than claiming a universal rule |
Plan a fair biological comparison
For a written investigation into solution concentration and potato mass, specify a range of concentrations and measure mass before and after immersion. Keep starting cylinder dimensions, immersion time, solution volume and temperature consistent. Use the same gentle blotting procedure before each final weighing so surface liquid does not become an uncontrolled difference.
Include several comparable samples at each concentration and explain how you will compare their percentage changes. Biological samples vary, so repeated measurements provide information that one cylinder cannot. If one result is unusual, investigate the record and method rather than silently deleting it. These are planning ideas to discuss with a teacher, not a substitute for supervised practical instructions.
Turn corrections into the next practice task
- Attempt one drawing, one calculation and one data question without notes.
- Label each error: observation, units, arithmetic, graph or explanation.
- Practise a new example of the weakest skill and explain every step aloud.
- Return to a mixed timed task to check whether the improvement transfers.
Use our Biology revision guide to connect practical questions with theory, and the past-paper routine to review timed work. For individual feedback, Biology tutoring can help you identify whether a weak answer comes from the science, the calculation or the way the evidence is described.
Frequently asked questions
01How long is IGCSE Biology 0610 Paper 6?
Under the 2026–2028 syllabus, Alternative to Practical is one hour long, has 40 marks and contributes 20% of the qualification.
02How do I calculate magnification in Biology?
Magnification equals image size divided by actual size. Convert both lengths to the same unit before dividing. The resulting magnification is a ratio without a length unit.
03Should biological drawings be shaded?
The 0610 syllabus drawing guidance calls for clear, unbroken pencil lines without shading or colour. Draw the visible features in proportion and follow the question's instructions about labels.